
PERT, CPM and Gantt Charts
PERT – Program Evaluation and Review Technique Developed by Lockheed Corporation in participation with the US Navy Polaris Missile/Submarine Project in 1958
CPM – Critical Path Method developed by DuPont c.1958
WBS – Work Breakdown Structure
A complete depiction of the entire task necessary to achieve successful project completion. Project plans that delineate all the tasks that must be accomplished to successfully complete a project from which scheduling, delegating, and budgeting are derived.
Gantt Charts: Henry Gantt who the Gantt chart is named, worked for the department of defense during the First World War. The chart is widely used as a project management tool. The Gantt chart allows you to see start and stop date for project task and subtask.
Gantt Charts are derived from your Work Breakdown Structure WBS
Critical Path – The longest complete path of a project.
Critical Task – A single task along a critical path
Deliverables –Something of value generated by a team or individual as scheduled often taking the form of a plan, report, procedure, product, or service.
Dependant Task – A task or subtask that cannot be initiated until a predecessor task or several predecessor tasks are finished.
Dummy Task – A link that shows an association or relationship between two otherwise parallel tasks along a PERT/CPM network.
Milestone – A significant event or juncture in the project.
Noncritical Task – A task within a CPM network for which slack time is available.
Parallel Task – Two or more tasks that can be undertaken at the same time. This does not imply that they have the same starting and ending times.
Path – A chronological sequence of tasks, each dependant on the predecessors.
Predecessor Task – Task that must be completed before another task can be completed.
PERT, CPM and Gantt Charts The allocation of resources over a specific timeframe and the coordination of interrelated events to accomplish an overall objective while meeting both predictable and unique challenges.
Project Constraint – A critical project element such as money, time, or human resources.
Scope of the project or scope of the project – The level of activity and effort necessary to complete a project and achieve the desired outcomes as measured by hours, days, resources consumed, and funds spent.
Slack – Margin or extra room to accommodate anticipated potential short falls in planning
Slack Time – The time interval in which you have leeway as to when a particular task needs to be completed.
Task or Event – A divisible, definable unit of work related to a project, which may or may not include subtasks.
Timeline – The scheduled start and stop times for a subtask, task, phase or entire project.
PERT, CPM and GANTT :-
Before attempting to use these tools, the project’s information must be assembled in a certain way. I include a basic description of the preceding steps.
The project planning process consists of the following:
1.Setting the project start date
2.Setting the project completion date
3.Selecting the project methodology or project life cycle to be used
4.Determining the scope of the project in terms of the phases of the selected project methodology or project life cycle
5.Identifying or selecting the project review methods to be used
6.Identifying any predetermined interim milestone or other critical dates which must be met.
7.Listing tasks, by project phase, in the order in which they might be accomplished.
8.Estimating the personnel necessary to accomplish each task
9.Estimating the personnel available to accomplish each task
10.Determining skill level necessary to perform each task
11.Determining task dependencies
Which tasks can be done in parallel?
Which tasks require the completion of other tasks before they can start?
12.Project control or review points
13.Performing project cost estimation and cost-benefit analysis
Work breakdown Structures
The development of a project plan is predicated on having a clear and detailed understanding of both the tasks involved, the estimated length of time each task will take, the dependencies between those tasks, and the sequence in which those tasks have to be performed. Additionally, resource availability must be determined in order to assign each task or group of tasks to the appropriate worker.
One method used to develop the list of tasks is to create what is known as a work breakdown structure.
A definition
A work breakdown structure (WBS) is a hierarchic decomposition or breakdown of a project or major activity into successive levels, in which each level is a finer breakdown of the preceding one. In final form a WBS is very similar in structure and layout to a document outline. Each item at a specific level of a WBS is numbered consecutively (e.g., 10, 10, 30, 40, 50). Each item at the next level is numbered within the number of its parent item (e.g., 10.1, 10.2, 10.3, 10.4).
The WBS may be drawn in a diagrammatic form (if automated tools are available) or in a chart resembling an outline.
The WBS begins with a single overall task representing the totality of work to be performed on the project. This becomes the name of the project plan WBS. Using a methodology or system life cycle (analysis, design and implementation) steps as a guide, the project is divided into its major steps. The first phase is project initiation; the second major phase is analysis, followed by design, construction, testing, implementation, and post-implementation follow-up. Each of these phases must be broken in their next level of detail, and each of those, into still finer levels of detail, until a manageable task size is arrived at. The first WBS level for the life cycle would be:
WBS number :- Task Description
1.0Project initiation
1.1Draft project plan
2.0Analysis phase
2.1Plan user interviews
2.2Schedule users interviews
3.0Examination and test
4.0Design
5.0Test
6.0Implementation
Post-implementation review
Tasks at each successively finer level of detail are numbered to reflect the task from which they were derived. Thus, the first level of tasks would be numbered 1.0, 2.0, 3.0, and so forth. Each of their subtasks would have a two-part number: the first part reflecting the parent task and the second part, the subtasks number itself, such as 1.1, 1.2, or 1.3. As each of these, in turn, decomposed or broken down into its component tasks, each component receives a number comprised of its parent number plus a unique number of its own.
A definition :-
A manageable task is one in which the expected results can be easily identified; success, failure, or completion of the task can be easily ascertained; the time to complete the task can be easily estimated; ant the resource requirements of the task can be easily determined.
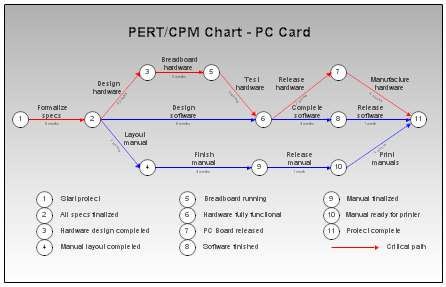
Program evaluation and review technique (PERT) charts depict task, duration, and dependency information. Each chart starts with an initiation node from which the first task, or tasks, originates. If multiple tasks begin at the same time, they are all started from the node or branch, or fork out from the starting point. Each task is represented by a line, which states its name or other identifier, its duration, the number of people assigned to it, and in some cases the initials of the personnel assigned. The other end of the task line is terminated by another node, which identifies the start of another task, or the beginning of any slack time, that is, waiting time between tasks.
Each task is connected to its successor tasks in this manner forming a network of nodes and connecting lines. The chart is complete when all final tasks come together at the completion node. When slack time exists between the end of one task and the start of another, the usual method is to draw a broken or dotted line between the end of the first task and the start of the next dependent task.
A PERT chart may have multiple parallel or interconnecting networks of tasks. If the scheduled project has milestones, checkpoints, or review points (all of which are highly recommended in any project schedule), the PERT chart will note that all tasks up to that point terminate at the review node. It should be noted at this point that the project review, approvals, user reviews, and so forth all take time. This time should never be underestimated when drawing up the project plan. It is not unusual for a review to take 1 or 2 weeks. Obtaining management and user approvals may take even longer.
When drawing up the plan, be sure to include tasks for documentation writing, documentation editing, project report writing and editing, and report reproduction. These tasks are usually time-consuming; so don’t underestimate how long it will take to complete them.
PERT charts are usually drawn on ruled paper with the horizontal axis indicating time period divisions in days, weeks, months, and so on. Although it is possible to draw a PERT chart for an entire project, the usual practice is to break the plans into smaller, more meaningful parts. This is very helpful if the chart has to be redrawn for any reason, such as skipped or incorrectly estimated tasks.
Many PERT charts terminate at the major review points, such as at the end of the analysis. Many organizations include funding reviews in the projects life cycle. Where this is the case, each chart terminates in the funding review node.
Funding reviews can affect a project in that they may either increase funding, in which case more people have to make available, or they may decrease funding, in which case fewer people may be available. Obviously more or less people will affect the length of time it takes to complete the project.
Critical Path Method (CPM) charts are similar to PERT charts and are sometimes known as PERT/CPM. In a CPM chart, the critical path is indicated. A critical path consists that set of dependent tasks (each dependent on the preceding one), which together take the longest time to complete. Although it is not normally done, a CPM chart can define multiple, equally critical paths. Tasks, which fall on the critical path, should be noted in some way, so that they may be given special attention. One way is to draw critical path tasks with a double line instead of a single line.
Tasks, which fall on the critical path, should receive special attention by both the project manager and the personnel assigned to them. The critical path for any given method may shift as the project progresses; this can happen when tasks are completed either behind or ahead of schedule, causing other tasks which may still be on schedule to fall on the new critical path.
A Gantt chart is a matrix, which lists on the vertical axis all the tasks to be performed. Each row contains a single task identification, which usually consists of a number and name. The horizontal axis is headed by columns indicating estimated task duration, skill level needed to perform the task, and the name of the person assigned to the task, followed by one column for each period in the project’s duration. Each period may be expressed in hours, days, weeks, months, and other time units. In some cases it may be necessary to label the period columns as period 1, period 2, and so on.
The graphics portion of the Gantt chart consists of a horizontal bar for each task connecting the period start and period ending columns. A set of markers is usually used to indicate estimated and actual start and end. Each bar on a separate line, and the name of each person assigned to the task is on a separate line. In many cases when this type of project plan is used, a blank row is left between tasks. When the project is under way, this row is used to indicate progress, indicated by a second bar, which starts in the period column when the task is actually started and continues until the task is actually completed. Comparison between estimated start and end and actual start and end should indicate project status on a task-by-task basis.
Variants of this method include a lower chart, which shows personnel allocations on a person-by-person basis. For this section the vertical axis contains the number of people assigned to the project, and the columns indicating task duration are left blank, as is the column indicating person assigned. The graphics consists of the same bar notation as in the upper chart indicates that the person is working on a task. The value of this lower chart is evident when it shows slack time for the project personnel, that is, times when they are not actually working on any project.
PERT Chart with start/stop dates
PERT Chart with Critical Path detail.
Firstly that’s a great article. Thanks for such useful information. I just recently started off with a website with my friends. I needed some help to optimize my revenue. As we’ve just started off, I know that the income is going to be really low. But all I wanted to know what are the good practices or ways to optimize the CPM ads on my website. I wanted to know things like:1) What category of website earns the most out of a CPM ad agency? 2) How many ads per page gives the best outcome? Is it best to have 1 ad per page from 1 ad agency or many ads per page from the same ad agency? Or is it better to have 1 ad from 1 ad agency and work with many ad agencies like that? 3)What size of banner makes the most money? Also, what are the best possible placements of ads on a page? 4)Usually which country’s traffic fetches maximum earnings?
I’ll be extremely grateful to receive a reply to this. This will help me a lot.